
Methods + Downloads
How we collected and analyzed the data behind Race to Lead, plus access to full reports, datasets, and supplementary materials
Using the Insight Hub
The Race to Lead Insight Hub is organized around seven themes covering the nonprofit workforce, leadership pathways, workplace conditions, racial equity and organizational power, compensation, executive leadership, and the changing environment in which nonprofits operate. Each thematic page begins with an overview and includes interactive visualizations that allow you to examine patterns across survey years and groups.
Exploring the dashboards
Use the navigation menu to move among themes and the sections within each theme. Many visualizations include filters that allow you to explore results by survey year, race and ethnicity, gender, organizational role, leadership composition, and other characteristics. The filters available will vary depending on the questions included in each survey wave and the populations represented in a particular chart.
Selecting a filter updates the applicable visualization. Filters should be interpreted together: applying several filters at once may produce a much smaller group of respondents. To return to the original view, clear your selections or use the dashboard’s reset option.
Hover over chart elements to see additional information, which may include percentages, response counts, definitions, or notes about the measure. Some charts also allow you to select a category to highlight or compare results.
Interpreting the findings
Race to Lead is a recurring survey of nonprofit workers, not a nationally representative survey of the entire nonprofit workforce. The findings describe the people who participated in each survey wave and should not be treated as precise estimates of sector-wide prevalence or change.
Keep the following in mind as you explore:
- Sample sizes vary across charts because some questions were asked only of certain respondents, were not included in every survey year, or were skipped by some participants.
- Percentages are generally calculated from respondents who provided a valid answer to the question shown.
- Percentages may not total 100% because of rounding, missing responses, or questions that allowed respondents to select more than one answer.
- Some categories have been combined or harmonized to support comparison across survey years.
- Small groups can produce less stable percentages. Where results are suppressed or accompanied by a caution, avoid drawing conclusions from small differences.
- Changes across survey waves may reflect changes in the nonprofit sector, differences in who participated, changes to survey questions, or broader social and political conditions.
The dashboards are designed to support exploration rather than establish causal relationships. Differences between groups should be read as descriptive patterns unless accompanying text states otherwise.
For additional information about survey administration, eligibility, data harmonization, and analytic decisions, see the Methodology section below.
Our Methodology
Data Collection Process
Race to Lead is a recurring survey of nonprofit workers across the United States and its territories, conducted by Building Movement Project. The survey has been fielded across four waves: 2016, 2019, 2022, and 2025. Survey administration and data-processing procedures varied across waves. The information below describes the 2025 survey; documentation for earlier waves is available in the Reports & Documentation section.
The 2025 survey was administered online and distributed through Building Movement Project’s outreach channels and a network of survey distribution partners. Respondents completed the survey anonymously, and responses are analyzed in aggregate. The 2025 survey asked about respondents’ nonprofit roles, organizational context, leadership pathways, workplace experiences, DEI efforts, external threats, funder responses, and identity and background.
The Race to Lead Insight Hub brings together data across survey waves to help users explore both long-standing patterns and emerging shifts in nonprofit workers’ experiences.
Eligibility Criteria
Race to Lead is designed for people who currently work for pay at nonprofit organizations in the United States and its territories. Respondents were eligible if they indicated that they worked full-time or part-time for a nonprofit organization in the United States and its territories. Respondents who were board members only, volunteers, unpaid interns, independent consultants, workers outside the nonprofit sector, or employees of nonprofits outside the U.S. were screened out.
For 2025, Building Movement Project relied on the survey platform’s screener logic to determine eligibility and did not re-derive eligibility during cleaning. Disqualified respondents were removed from the analytic dataset.
Treatment of Partial Responses
The 2025 analytic sample includes both complete and partial survey responses that met the inclusion criteria described below. For 2025, BMP did not rely on the survey platform’s “complete” or “partial” status alone. Instead, the team defined “analytic engagement” as reaching at least one substantive survey section beyond the required identity questions.
To determine analytic engagement, the team created flags based on anchor questions from substantive sections of the survey, including organizational background, nonprofit experience, leadership development, career aspirations, workplace culture, and DEI in the organization. Respondents were included if they reached at least one of these analytic sections. This approach retained valid partial responses that would have been excluded under a complete-case-only rule.
For 2025, the raw Alchemer export included 2,525 total records. After removing 123 disqualified respondents, 2,402 eligible records remained. Of those, 1,855 were analytically engaged and included in the final analytic dataset.
Harmonization Approach
To support comparison across survey years, BMP developed a harmonized dataset that aligns comparable variables from the 2016, 2019, 2022, and 2025 surveys.
Where questions and response options remained consistent, variables were retained as directly comparable. Where wording, response options, or survey structure changed, variables were reviewed and standardized using a variable alignment process. In some cases, categories were combined, renamed, or mapped into shared indicators to support responsible comparison across years.
Not every survey question appears in every wave. Some topics were introduced in later years, including DEI-related questions in 2019, frontline worker questions in 2022, and additional questions on external threats and funder response in 2025. As a result, some Insight Hub charts include all four survey years, while others include only the years with comparable data.
Comparing Results Across Survey Years
Race to Lead provides a rich descriptive picture of nonprofit workers’ experiences over time. Across waves, the survey used online distribution and partner outreach, producing a nonprobability sample of nonprofit workers. Results should therefore be interpreted as patterns among Race to Lead respondents rather than estimates for the nonprofit workforce as a whole.
Use of Survey Weights
The Insight Hub presents unweighted results. Race to Lead uses a nonprobability sample, and comprehensive population benchmarks are not available for many of the characteristics central to the analysis, including the intersection of race, gender, organizational role, and organizational context. Under these conditions, weighting would not make the findings nationally representative and could introduce additional uncertainty, particularly when estimates are based on small groups.
The Insight Hub therefore presents unweighted percentages describing respondents in each survey wave. Differences across years may reflect changes in the sector, differences in who participated, changes to survey questions or distribution methods, and broader social and political conditions.
Missing Data and Sample Sizes
Sample sizes vary across visualizations because respondents could skip individual questions or because certain questions were asked only of eligible respondents. Percentages are calculated using valid responses for each question unless otherwise noted. Sample sizes are displayed in chart tooltips or notes where appropriate.
Who Participated in Race to Lead?
Race to Lead has collected responses from 14,228 nonprofit workers across four survey waves. The number and composition of respondents varied from wave to wave, reflecting differences in outreach, participation, survey design, and the broader context in which each survey was fielded. The characteristics below provide context for understanding and comparing the four survey samples.
Sample at a Glance
| Sample characteristic | 2016 | 2019 | 2022 | 2025 |
| Respondents included | 4,055 | 5,258 | 3,060 | 1,855 |
| People of color | 42.3% | 40.5% | 39.7% | 53.9% |
| White | 57.7% | 59.5% | 60.3% | 46.2% |
| Cisgender women | 78.0% | 79.6% | 75.9% | 70.6% |
| LGBTQIA+ | 20.9% | 21.2% | 24.7% | 32.2% |
| Has a disability | Not collected | 10.0% | 20.4% | 24.5% |
| Executive leadership | 21.7% | 23.5% | 28.4% | 27.6% |
| Management | 48.6% | 51.7% | 51.6% | 45.7% |
| Staff | 29.8% | 24.8% | 20.0% | 26.7% |
| Median years in nonprofit sector | 10 | 10 | 13 | 12 |
Understanding Differences in Participation
Participation declined from 5,258 respondents in 2019 to 1,855 in 2025, and the racial composition of the sample also shifted. These changes may reflect differences in survey outreach and distribution, changes in the nonprofit workforce, respondents’ interest in the survey topics, the political environment surrounding racial equity and DEI, or other factors that cannot be directly measured with the survey data.
The 2025 sample may include a particularly engaged segment of nonprofit workers and organizations with a strong interest in equity, leadership, and workplace change. Race to Lead cannot determine whether this accounts for the change in participation. Comparisons across waves should therefore be interpreted as changes among Race to Lead respondents, not as direct estimates of change across the nonprofit sector.
To explore more detailed respondent demographics, visit here
Reports & Documentation
2024
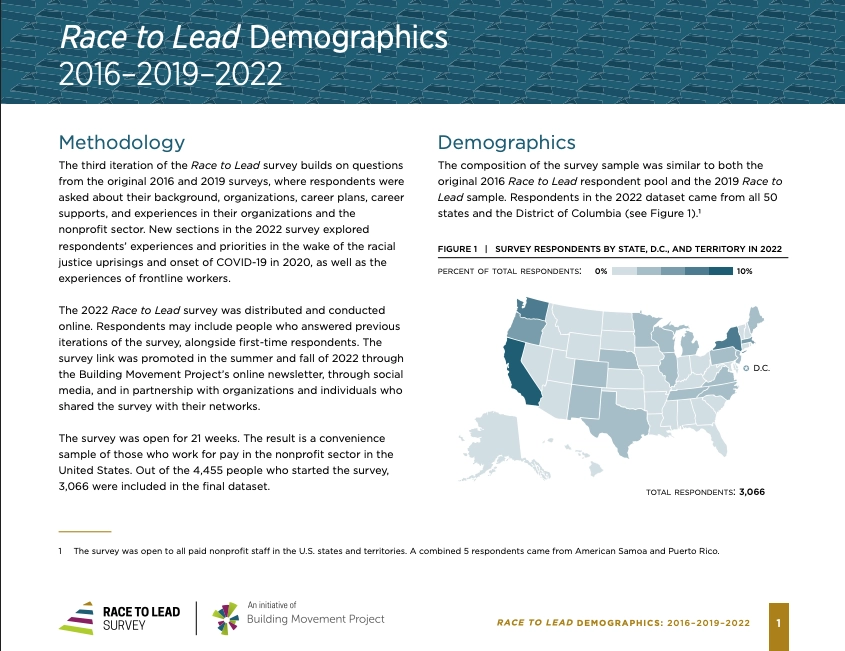
Race to Lead Demographics: 2016–2019–2022
Brief Highlights the demographic composition of Race to Lead respondents across all three survey waves
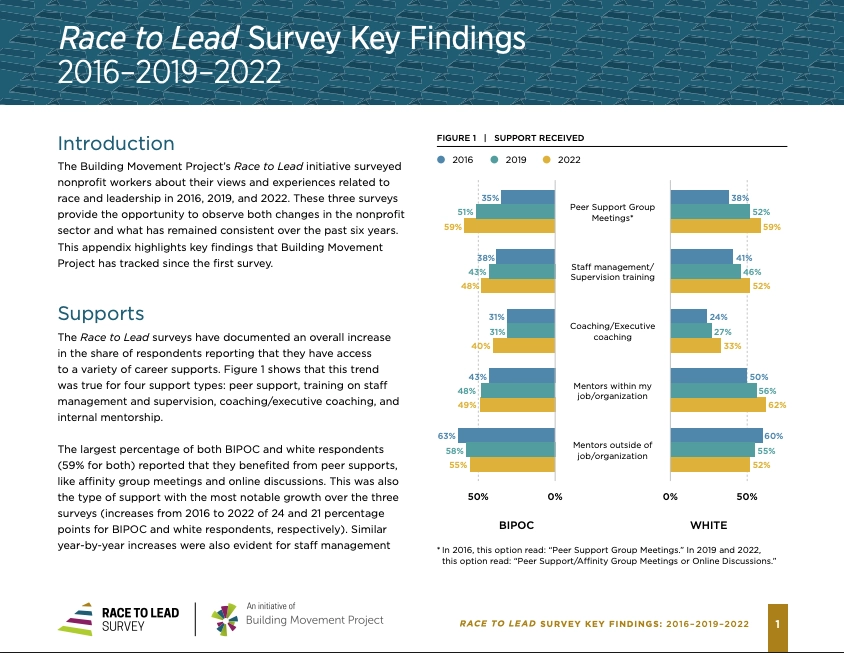
Race to Lead Survey Key Findings: 2016–2019–2022
Brief Tracks headline findings across all three survey waves — career supports, career challenges, and the racialized impact of career advancement.
Blocking the Backlash: The Positive Impact of DEI in Nonprofit Organizations
The Push and Pull: Declining Interest in Nonprofit Leadership
Tracks a steady decline in aspiration to top leadership roles and identifies what’s pushing and pulling people away from the executive track.
2022
Trading Glass Ceilings for Glass Cliffs: A Race to Lead Report on Nonprofit Executives of Color
Shows that reaching the executive suite doesn’t end a leader of color’s struggles with racism — and sometimes increases them, especially for those succeeding a white leader.
2020
The Burden of Bias in the Bay State: The Nonprofit Racial Leadership Gap in Massachusetts
A follow-up Massachusetts brief building on the 2016 MA report, finding the burden of DEI implementation still falls disproportionately to people of color.
The Nonprofit Racial Leadership Gap in New Mexico: A Race to Lead Brief
Regional findings from New Mexico, including insights from Albuquerque focus groups on advancing race equity in the sector.
The Nonprofit Racial Leadership Gap in the Memphis Area: A Race to Lead Brief
Regional findings from Memphis, exploring race and race equity in the nonprofit sector of a city known for civil rights activism.
The Nonprofit Racial Leadership Gap in the Milwaukee Area: A Race to Lead Brief
The Nonprofit Racial Leadership Gap in Central Texas: A Race to Lead Brief
Regional findings from the Austin metro area, exploring how local leadership networks affect career and funding prospects.
Race to Lead Revisited: Obstacles and Opportunities in Addressing the Nonprofit Racial Leadership Gap
The second national report, adding new findings on financial circumstances and DEI efforts in the workplace.
2019
Nonprofit Executives and the Racial Leadership Gap: A Race to Lead Brief
Shifts focus to nonprofit EDs/CEOs of color, examining how the pressures of executive leadership are heightened for people of color
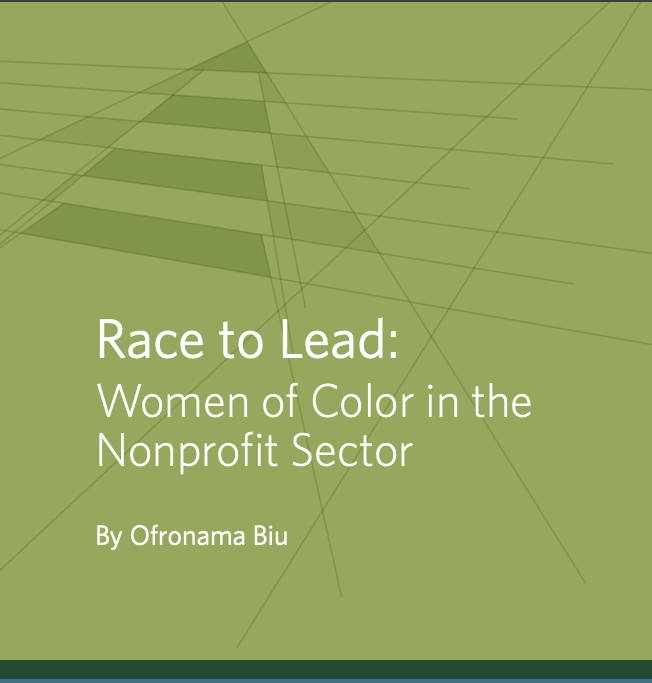
Race to Lead: Women of Color in the Nonprofit Sector
2018
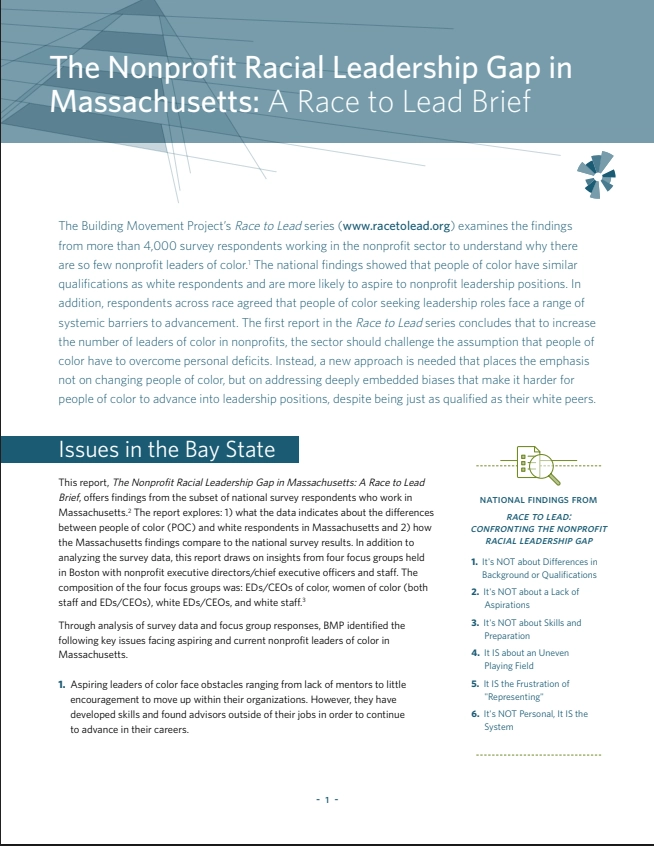
The Nonprofit Racial Leadership Gap in Massachusetts: A Race to Lead Brief
A regional look at the racial leadership gap among Massachusetts nonprofit staff, compared to national survey results.
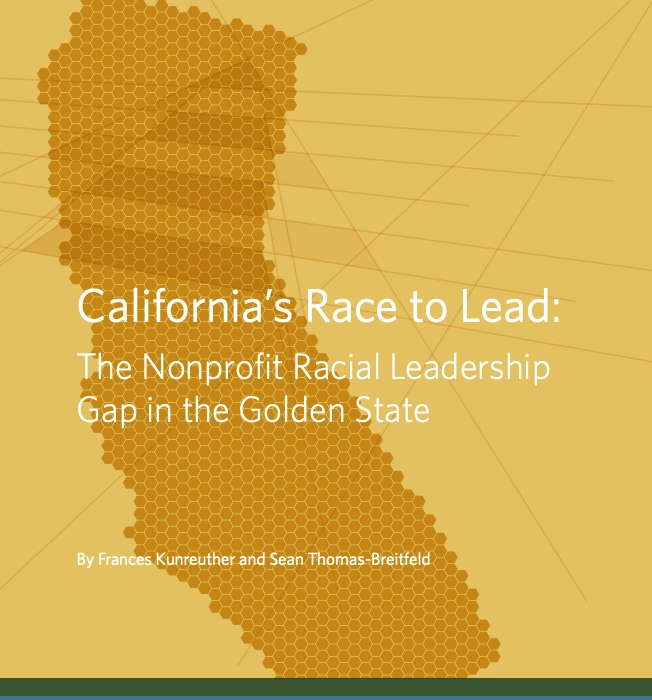
California’s Race to Lead: The Nonprofit Racial Leadership Gap in the Golden State
Explores how California’s nonprofit workforce demographics compare nationally, finding more support and fewer barriers for people of color than in other states — but still slow progress.
2017
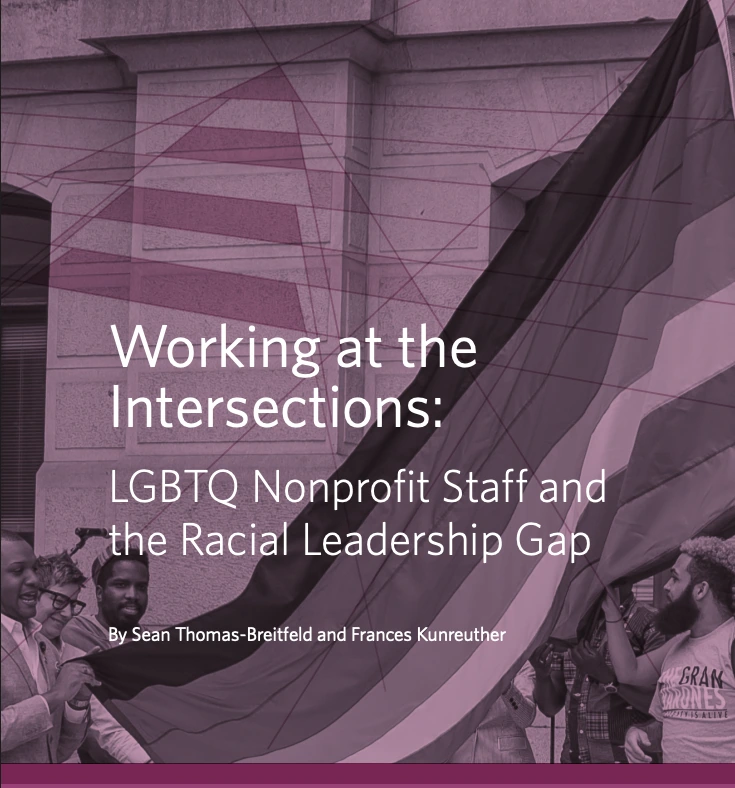
Working at the Intersections: LGBTQ Nonprofit Staff and the Racial Leadership Gap
Examines the added barriers LGBTQ people of color face in the nonprofit sector from the combination of racial bias and inconsistent legal protections.
Race to Lead: Confronting the Nonprofit Racial Leadership Gap
Citations
Whether you’re citing an interactive dashboard, downloading a figure for a presentation, or referencing Race to Lead findings in a publication, please use the citation format below.
If you are reproducing charts or statistics from the Insight Hub, please cite the Insight Hub rather than an individual dashboard.
Building Movement Project. (2026). Race to Lead Insight Hub.
Building Movement Project. 2026. Race to Lead Insight Hub. Accessed July 10, 2026.
Building Movement Project. Race to Lead Insight Hub. Accessed 10 July 2026.
@misc{race_to_lead_insight_hub_2026,
author = {{Building Movement Project}},
title = {Race to Lead Insight Hub},
year = {2026},
howpublished = {\url{https://race.bmpr.org}},
note = {Accessed July 10, 2026}
}